
If I could only keep one monitor during anesthesia, it would be the capnograph. Effective capnograph interpretation gives you real-time insight into both ventilation and perfusion, and when you know how to read the waveform, it tells you far more than a number ever could.
That little line isn’t just showing CO₂ levels; it’s a story of gas exchange, cardiac output, and airway function. Once you learn to read it, you can spot trouble long before any other monitor warns you.
The Anatomy of a Capnogram
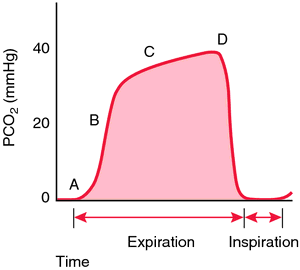
A normal capnogram has four distinct phases:
A: Phase I – Baseline: Inspiration. Fresh gas enters; no CO₂ is present.
B: Phase II – Upstroke: The beginning of exhalation. Alveolar gas starts mixing with dead-space air.
C: Phase III – Plateau: Pure alveolar gas. This is where you measure ETCO₂.
D: Phase 0 – Downstroke: Inhalation begins again.
Any deviation in that shape means something in your system, patient or equipment, has changed.
Common Waveforms and What They’re Telling You: Capnograph Interpretation Essentials
The Gradual Rise – Hypoventilation
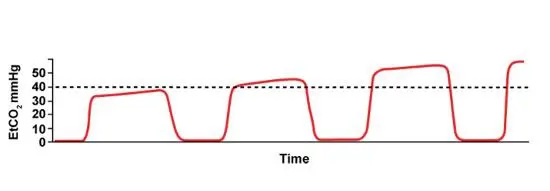
ETCO₂ creeping upward? The patient isn’t exhaling enough CO₂.
- Decreased ventilation rate or depth
- Excessive anesthetic depth
- CO₂ rebreathing due to exhausted absorbent or low flow
Remember: ETCO₂ increases before oxygen saturation drops.
The Shark Fin — Airway Obstruction or Bronchospasm

A slow upstroke and slanted plateau (“shark fin”) indicate partial obstruction, think bronchospasm, mucus, kinking, or compression. If the patient’s breathing spontaneously, they’re working harder. On a ventilator, you’ll see increased airway pressures. Treat the cause: deepen anesthesia, suction, or relieve the obstruction. This is fairly common to see in cats with asthma or after performing a bronchoalveolar lavage.
The Elevated Baseline — Rebreathing CO₂
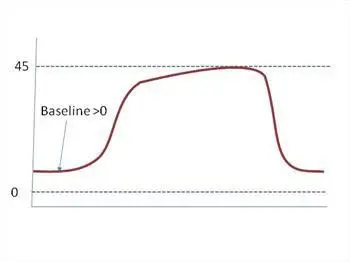
When the baseline never returns to zero, the patient is rebreathing exhaled CO₂. That means gas that should have been scavenged or flushed out is being inhaled again. Common reasons:
- Exhausted soda lime
- Malfunctioning inspiratory or expiratory valves
- Low fresh gas flow in non-rebreathing systems
It’s subtle and often missed until your patient becomes hypercapnic and sluggish.
The Plateau That Won’t Settle — Cuff Leak

If your ETCO₂ trace looks irregular or refuses to form a clean plateau, you may have a leak around the endotracheal tube cuff. You’ll see:
- A noisy, unstable plateau
- A waveform that drifts downward before inspiration
- Audible hissing or bubbling near the mouth
Leaks dilute sampled gas, giving you falsely low ETCO₂ and distorted waveforms. Check cuff inflation, tube size, and placement, especially in cats, small dogs, and brachycephalic dogs- once they get to a deeper plane and relax a leak can develop where there wasn’t one before.
The Sudden Flatline

If the capnograph is perfect one second and completely gone the next, your patient hasn’t suddenly died, either they’ve stopped breathing or you’re disconnected.
A true cardiac arrest causes a gradual, stepwise decline in ETCO₂ as perfusion drops, not an abrupt zero. A sudden flatline means:
- Apnea
- The sampling line came loose
- The ETT popped out
- The circuit disconnected somewhere along the way
Knowing that distinction keeps you focused where it matters.
Flatline but chest rising → check the equipment.
Waveform fading over several breaths → check perfusion.
The Exponential Decrease — Impending Arrest
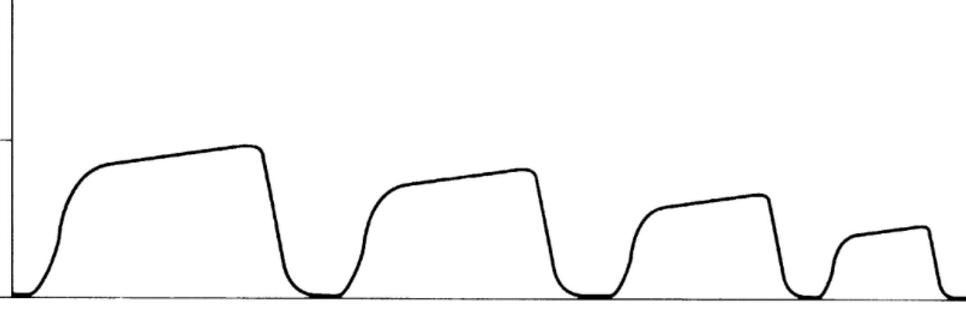
When the waveform decreases gradually but exponentially over several breaths, the problem isn’t ventilation, it’s perfusion.
This pattern means that cardiac output is falling. With each passing beat, less CO₂-rich blood is reaching the lungs, so alveolar CO₂ levels taper off in a smooth, downward slope.
You’ll often see this when:
- The patient is becoming profoundly hypotensive
- Cardiac output is dropping due to arrhythmia or severe bradycardia
- Arrest is imminent
It’s a physiologic fade, not a disconnection. If you see this trend, check your pulse, blood pressure, and ECG immediately. You may be seconds away from full arrest. Early intervention here can make the difference between a recovery and a code.
Reading Physiology, Not Just Patterns
Each change in waveform tells a story:
- Shape change = mechanical or airway issue
- Gradual trend = metabolic or ventilatory change
- Sudden loss = equipment problem (most of the time)
ETCO₂ reflects both ventilation and perfusion, but capnograph interpretation depends on context. Learn the patterns, and the capnograph becomes a diagnostic tool instead of background noise.
The Takeaway
Your capnograph is more than a number. It’s the clearest window into what’s happening inside your patient right now. With confident capnograph interpretation, each change in the waveform becomes meaningful. A shift in shape often points to a mechanical or airway issue. A gradual trend usually reflects a metabolic or ventilatory change. And a sudden loss, more often than not, signals an equipment problem.
When you understand what the capnograph is telling you, it stops being background noise and becomes one of the most powerful diagnostic tools at your disposal. If you have questions about anesthesia monitoring or want support interpreting what you’re seeing during a case, contact us. We’re always here to help.
Images used under creative commons license – commercial use (11/18/2025) Photo by Imre Magyar on Unsplash